

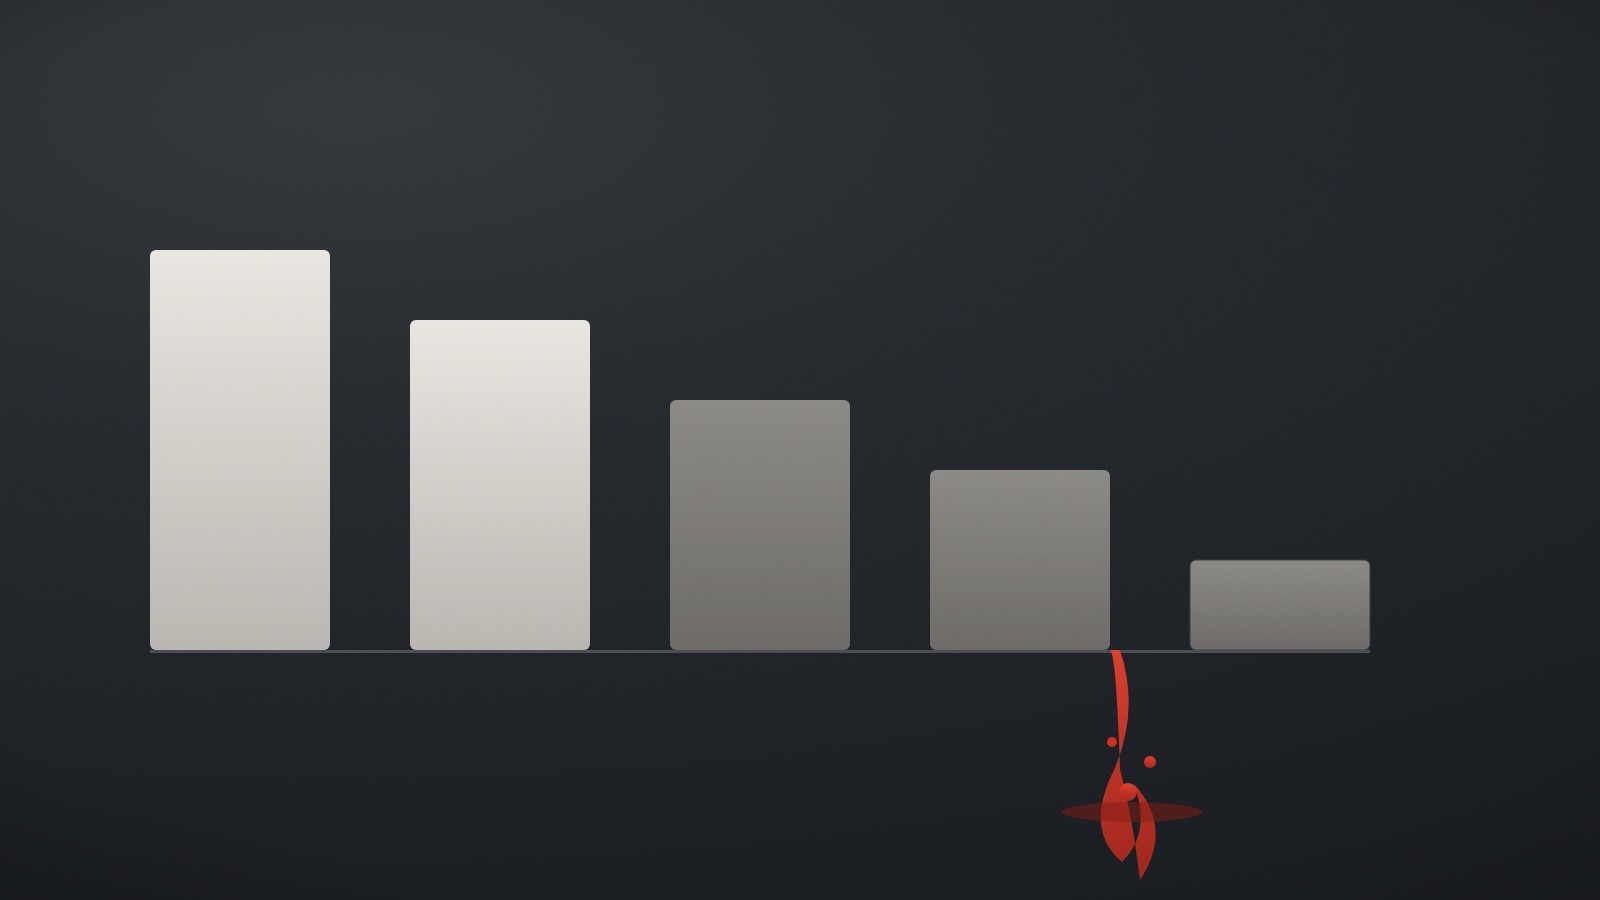
Why the leak stays invisible
Most businesses never calculate it, because the reporting stops at the lead and the revenue lives in the CRM, and nobody joins the two. Your ad dashboard is green. Cost per lead is acceptable. And sales still says the leads are weak. That gap between "the dashboard looks good" and "the sales team says the leads are poor" is not a feeling. It has a number attached, and until you run the whole chain end to end, the number is hidden inside four conversion rates nobody reviews together.
This is the mistake behind "our cost per lead is fine, but what is the cost per customer?" A low cost per lead can sit on top of an expensive acquisition problem. The leak is rarely at the top of the funnel, where everyone looks. It is in the middle, between first impression and closed revenue, where marketing hands off to sales and nobody owns the whole path.
The formula
Here is the whole thing, and it is the most useful line in this post:
Attributable revenue = leads × booking rate × show rate × qualification rate × close rate × average first-sale value
Each stage is a percentage of the one before it. Leads become booked calls. Booked calls become attended calls. Attended calls become genuinely qualified conversations. Qualified conversations become customers. Because the stages multiply, a weak rate anywhere drags the entire result down, and no single dashboard shows you that, because each stage lives in a different tool.
Define the terms so the arithmetic is honest:
- Booking rate — the share of leads who book a call.
- Show rate — the share of booked calls who attend.
- Qualification rate — the share of attended calls that were a genuine fit, not just a warm body.
- Close rate — the share of qualified calls that became customers.
- Average first-sale value — the first transaction only, not lifetime value. Keep it conservative; this is a diagnostic, not a pitch deck.
A worked example
Take 100 leads a month. Run them through a chain that most founders would call "fine":
- 100 leads → 40% booking → 40 calls booked
- 40 booked → 70% show → 28 attend
- 28 attended → 50% qualification → 14 qualified
- 14 qualified → 20% close → 2.8 customers
Now lift each stage to what a well-run acquisition system reaches:
- 100 leads → 50% booking → 50 calls booked
- 50 booked → 80% show → 40 attend
- 40 attended → 60% qualification → 24 qualified
- 24 qualified → 25% close → 6 customers
Same 100 leads. 2.14 times the customers. Nothing in that second chain required a larger ad budget, a new channel, or more content. It required fixing four conversion rates that were quietly leaking. If your average first sale is £4,000, that is the difference between £11,200 and £24,000 a month from the exact same spend. The leak, in this example, is roughly £12,800 every month it stays open.
That is the number the reporting hides, and it is why "spend more on ads" is so often the wrong first move. Doubling the leads at the top of a leaking chain doubles the leak too.
Which stage do you fix first?
Fix the stage with the lowest conversion rate. This is not a rule of thumb, it falls out of the arithmetic. In a chain of multiplied rates, the extra revenue you gain by lifting one stage by a fixed number of points is proportional to the product of every other rate. So the lowest rate always has the largest headroom, and lifting it returns the most money per point. Improve your weakest link and the whole chain moves.
In the example above, close rate (20%) and qualification (50%) are the soft spots, not booking. A founder staring at that chain would be tempted to buy more traffic. The maths says the money is downstream.
Once you know which stage leaks, the cause usually points to a specific fix:
| Leaking stage | What is actually wrong | What fixes it |
|---|---|---|
| Booking rate | Prospects arrive cold, with no familiarity or trust built before the ask. | Warm the audience first, with proof-led retargeting of people who already watched. |
| Show rate | Slow speed to lead, weak reminders, calls booked too far out. | Faster follow-up and a tighter appointment process. |
| Qualification rate | The message is attracting the wrong buyer. Cheap leads, wrong fit. | Sharper message and creative, so the right person self-selects in. |
| Close rate | Sales starts every call from zero. Content is not pre-selling. | Message and creative that pre-sell, so prospects arrive already believing. |
| All rates healthy | Nothing is leaking. | Nothing. The constraint is spend, and it is now safe to scale it. |
Show rate is worth a special mention. It leaks fastest when speed to lead is slow, which is why responding to a new lead within five minutes is one of the cheapest points you can recover in the whole chain.
When there is no leak
Sometimes you run the chain and every rate is already strong. If that is your business, the honest answer is that you do not have a leak, you have room to scale. The constraint is not conversion, it is spend, and it is now safe to put more money in, because you know it will come out the other end as customers rather than as wasted budget.
I would rather tell a founder that than force a diagnosis. Naming the real constraint, even when it is not the thing I sell, builds more trust than pretending every business has the same problem. This whole method is a form of that. It is designed to tell you the truth about your own numbers, and occasionally the truth is "you are fine, go faster."
It also tells some businesses the opposite: that the problem is upstream of everything here. If your offer is not yet proven, or your margins cannot support paid acquisition, the chain will look broken no matter how good the marketing is. The leak formula assumes a working business with a real offer and a functioning sales process. Fix those first, then come back to the chain.
Put your own numbers in
Reading the formula is one thing. Seeing it run on your business is where it lands. I built a free Revenue Leak Calculator that does exactly this: you put in seven numbers you already know, spend, leads, and the four rates, and it lays out your full chain end to end, tells you which single stage is costing you the most, and puts a monthly and annual figure on the leak. No call, no download, the number appears on the screen. It runs the same arithmetic as this post, on your own data.
Most of the founders I work with have never seen their own chain laid out this way. The number at the end is usually larger than they expected, and it is almost never at the stage they assumed.
Frequently asked questions
What numbers do I need to calculate my revenue leak?
Seven, and you already know or can estimate all of them in under a minute: monthly ad spend, leads per month, booking rate, show rate, qualification rate, close rate, and average first-sale value. If you do not track one of the rates precisely, estimate honestly and refine later. A rough chain built from real estimates is far more useful than no chain at all, because it still shows you which stage is weakest.
What are healthy conversion rates for each stage?
As a working target: booking 50%, show 80%, qualification 60%, close 25%. These are the rates a well-run acquisition system should reach, and they are the same figures used in the Attention-to-Revenue System model. They are not published industry averages, and your own sector may run higher or lower. Use them as a direction to move toward, not as a claim about what everyone else achieves.
Why not just spend more on ads to grow?
Because more spend at the top of a leaking chain multiplies the leak, not just the leads. If your close rate is 20%, buying twice the traffic buys you twice the leads that mostly do not close. The higher-return move is almost always to lift the weakest downstream rate first, then scale spend once the chain converts. More budget is the right answer only when the rates are already healthy. See why "spend more on ads" is usually the wrong fix for the fuller version.
Is average first-sale value or lifetime value the right input?
Use first-sale value for this calculation. Lifetime value flatters the number and makes the leak look smaller than it is in cash terms this month. The point of the exercise is to size the immediate, recurring loss, and to keep the figure defensible. If your model depends on repeat revenue, run the chain on first sale first, then layer LTV on separately once you trust the base number.
How is this different from a cost-per-lead report?
Cost per lead measures the top of the funnel only. This measures the whole path to revenue. A business can have an excellent cost per lead and a terrible cost per customer, because the leak sits between the lead and the sale. The chain formula is what connects the two, and cost per lead versus cost per acquisition explains why the second number is the one that decides whether you are actually profitable.
Sources
- The revenue chain formula and worked example (2.8 vs 6 customers on the same 100 leads) are from the Attention-to-Revenue System model. Target rates are that model's working benchmarks, not published industry averages.